What Determines Real Charging Speed?
Why the vehicle, charger, grid and battery all influence a charging session.
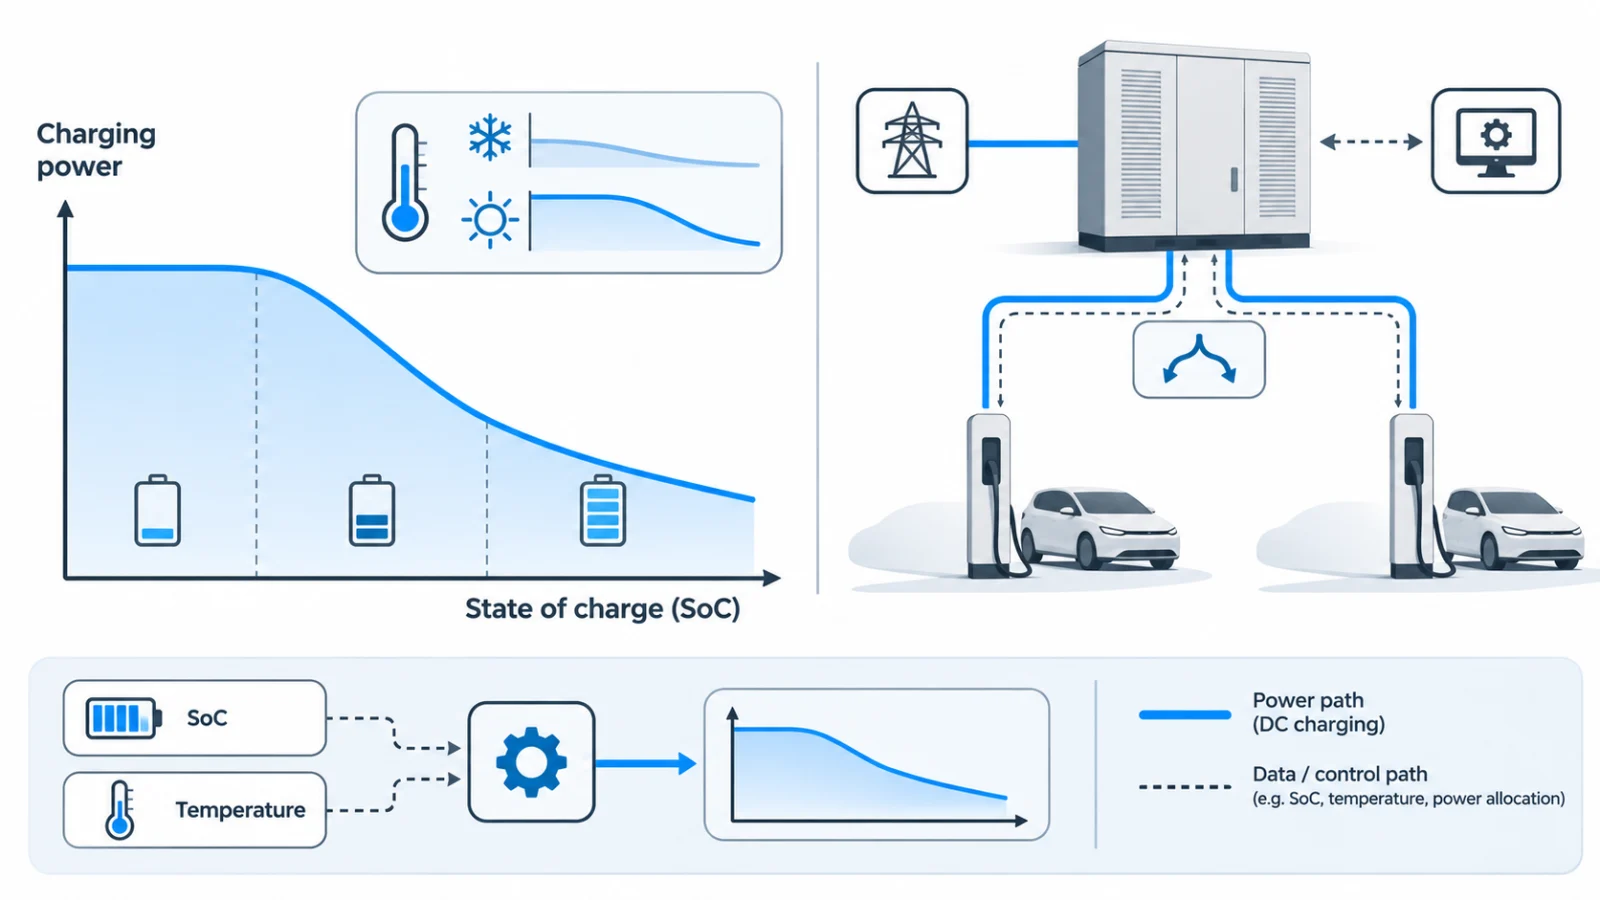
A chain of limits
The charger’s maximum rating is one limit among several. The electrical connection, charging cable, vehicle electronics and the battery management system can impose lower limits.
Charging curve
Many vehicles reduce DC charging power at higher battery state of charge. Temperature and battery conditioning can also affect power acceptance; headline peak charging rates do not describe the whole session.
Site sharing
Where multiple connectors or charge points share a power supply, active power sharing may change the delivered power. Procurement specifications should require clear definitions of total site power and simultaneous output.
Model an entire session, not a peak
A vehicle that can briefly reach a high DC power may have a much lower session average. Fleet schedules should calculate required delivered energy against realistic charging curves, arrival battery state and seasonal temperature rather than relying on marketing peak kW.
Shared cabinet and grid limits
For sites with two or more connectors, ask whether the stated power is per connector or total cabinet output. Define minimum simultaneous performance and how load management responds when the electrical connection is constrained.
Why might two connectors both show a lower power?
They may share available output or be constrained by the site supply; each vehicle may also limit its own current.
Primary references
Educational content, not installation or legal advice. Check current standards and local requirements.
Planning an EV charging project or sourcing enquiry?
CowinLink Limited works with manufacturing partners on EV charging sourcing, OEM/ODM and distribution enquiries. Share the target market, installation use case, preferred interface and estimated quantity; model specifications and compliance are checked for each project.
Discuss your project →